Using python to plot ledger transactions
ledger is a very capable piece of software for double-entry accounting. However, it only provides one out-of-the-box option for visualizing transactions: gnuplot. Rather than learn a non-FOSS tool (gnuplot is not really GNU), I set out to get ledger transactions into pandas. ledger includes python bindings which worked for 95% of my plotting needs, but some missing journal properties were ultimately a showstopper. Fortunately, the gnuplot flags (-J and -j) produce output almost ready to be parsed by pandas.
Using python-ledger
The python bindings are pleasant to use, but require some work to get into pandas.
# Necessary imports
import matplotlib.pyplot as plt
import ledger
import pandas as pd

# Read ledger journal
journal = ledger.read_journal("/data/ledger/finances.ldg")
Queries are performed to find transactions after the journal is read.
# Find all Income transactions
posts = journal.query("Income")
However, posts is not easily digestible by pandas. It is possible to build a parseable list by iterating through each transaction:
income = []
for post in journal.query("Income"):
    trans = {'Income':post.amount,'Datetime':post.date}
    income.append(trans)
incomeDF = pd.DataFrame(income)
The current incomeDF has a standard index (1,2,...X) and the Datetime column.
| Datetime | Income | |
|---|---|---|
| 0 | 2016-11-04 | $-115.23 |
| 1 | 2016-12-01 | $-144.04 |
| ... | ... | ... |
| 543 | 2017-04-24 | $-100.00 |
The standard index can be replaced with Datetime allowing Grouper methods to be used.
incomeDF = incomeDF.set_index(pd.DatetimeIndex(incomeDF['Datetime']))
| Income | |
|---|---|
| Datetime | |
| 2016-11-04 | $-115.23 |
| 2016-12-01 | $-144.04 |
| ... | ... |
| 2017-04-24 | $-100.00 |
The Income data is a string and cannot be plotted with pandas. The '$' can be removed and the new string cast as a float.
incomeDf['Income'] = incomeDF['Income'].replace('[\$]','',regex=True).astype(float)
With the transactions in a dataframe anything is possible.
Since the index is Datetime the transactions can be grouped by month and summed.
monthly = df.groupby(pd.TimeGrouper(freq='M'))
monthly = monthly.sum().ix['2016-06-01':'2016-12-31'].fillna(0).abs()
Creating a dataframe for "Expenses" and combining it with incomeDF
(pd.concat([incomeDF,expensesDF],join='outer')) allows a plot comparing Income and Expenses to be made.
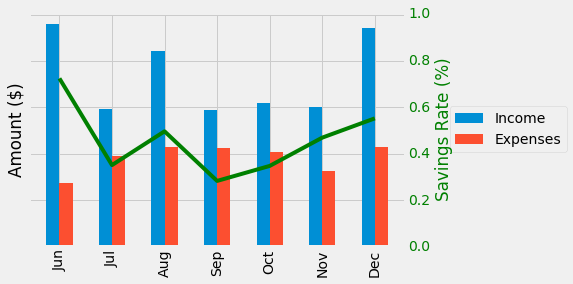
plt.style.use('fivethirtyeight')
ax = monthly.loc[:,['Income','Expenses']].plot.bar()
ax.set_xticklabels([dt.strftime('%b') for dt in monthly.index.to_pydatetime()])
plt.xlabel('')
plt.title('Income and Expenses Comparison')
rate = 1-(monthly['Expenses'])/monthly['Income']
ax2 = ax.twinx()
ax2.plot(rate.values,'g')
#ax.grid(False)
ax2.grid(False)
ax2.set_ylim([0,1])
ax.legend(loc='center left',bbox_to_anchor=(1.1,0.5))
ax.set_ylabel('Amount ($)')
ax2.set_ylabel('Savings Rate (%)', color='g')
ax2.tick_params('y',colors='g')
Using gnuplot output
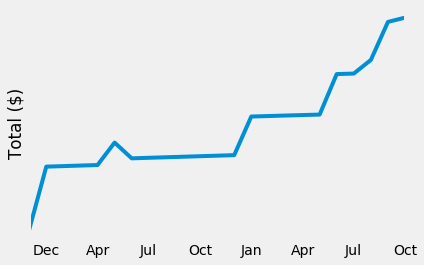
The -j and -J flags cause ledger to produce gnuplot friendly output. Fortunately, this output is straightforward: a date column and a transaction column. The -J provides a running total while -j produces each individual transaction amount.
...
2017-01-13 144.04
2017-01-13 1438.31
2017-01-13 450
...
Calling the ledger binary from python is accomplished using the subprocess module.
import subprocess as sp
import io
import pandas as pd

# Run ledger using subprocess
ledger_file = '/data/ledger/finances.ldg'
result = sp.run('ledger -f {} -JMRV reg Assets'.format(ledger_file),shell=True,stdout=sp.PIPE)
output = result.stdout.decode('ascii')
The results from sp.run are binary encoded and must be decoded to ASCII for python string operations to work.
Pandas' read_csv expects to read a file. Fortunately, io provides a way for an in-memory string to be treated as a file with StringIO.
# 'Fake' csv
f = io.StringIO(output)

# Create Dataframe
df = pd.read_csv(f,delim_whitespace=True,names=['Date','Amount'],parse_dates={'datetime':['Date']},index_col='datetime')
The transactions are trivial to plot now that they are stored in a dataframe.
df.loc['2007-12-01':'2009-10-01'].plot()
Was this information useful or thought provoking? Do you appreciate a webpage free of analytics or ads? Say thanks and help keep this site online by using my Amazon Affilliate URL . I'll receive a small percentage of purchases made within 24 hours of clicking. Or, feel free to donate BTC (1DNwgPQMfoWZqnH78yt6cu4WukJa3h8P1f) or ETH (0xf3c4a78c24D34E111f272Ac2AC72b1f01ba52DF3).